 Clinwright
14.2.1.3
Kaplan-Meier Plot of Duration of Response
Made 2026-10-17 from simulated data.
ONCO-EX
Figure 14.2.1.3
Kaplan-Meier Plot of Duration of Response
Intent-to-Treat Analysis Set
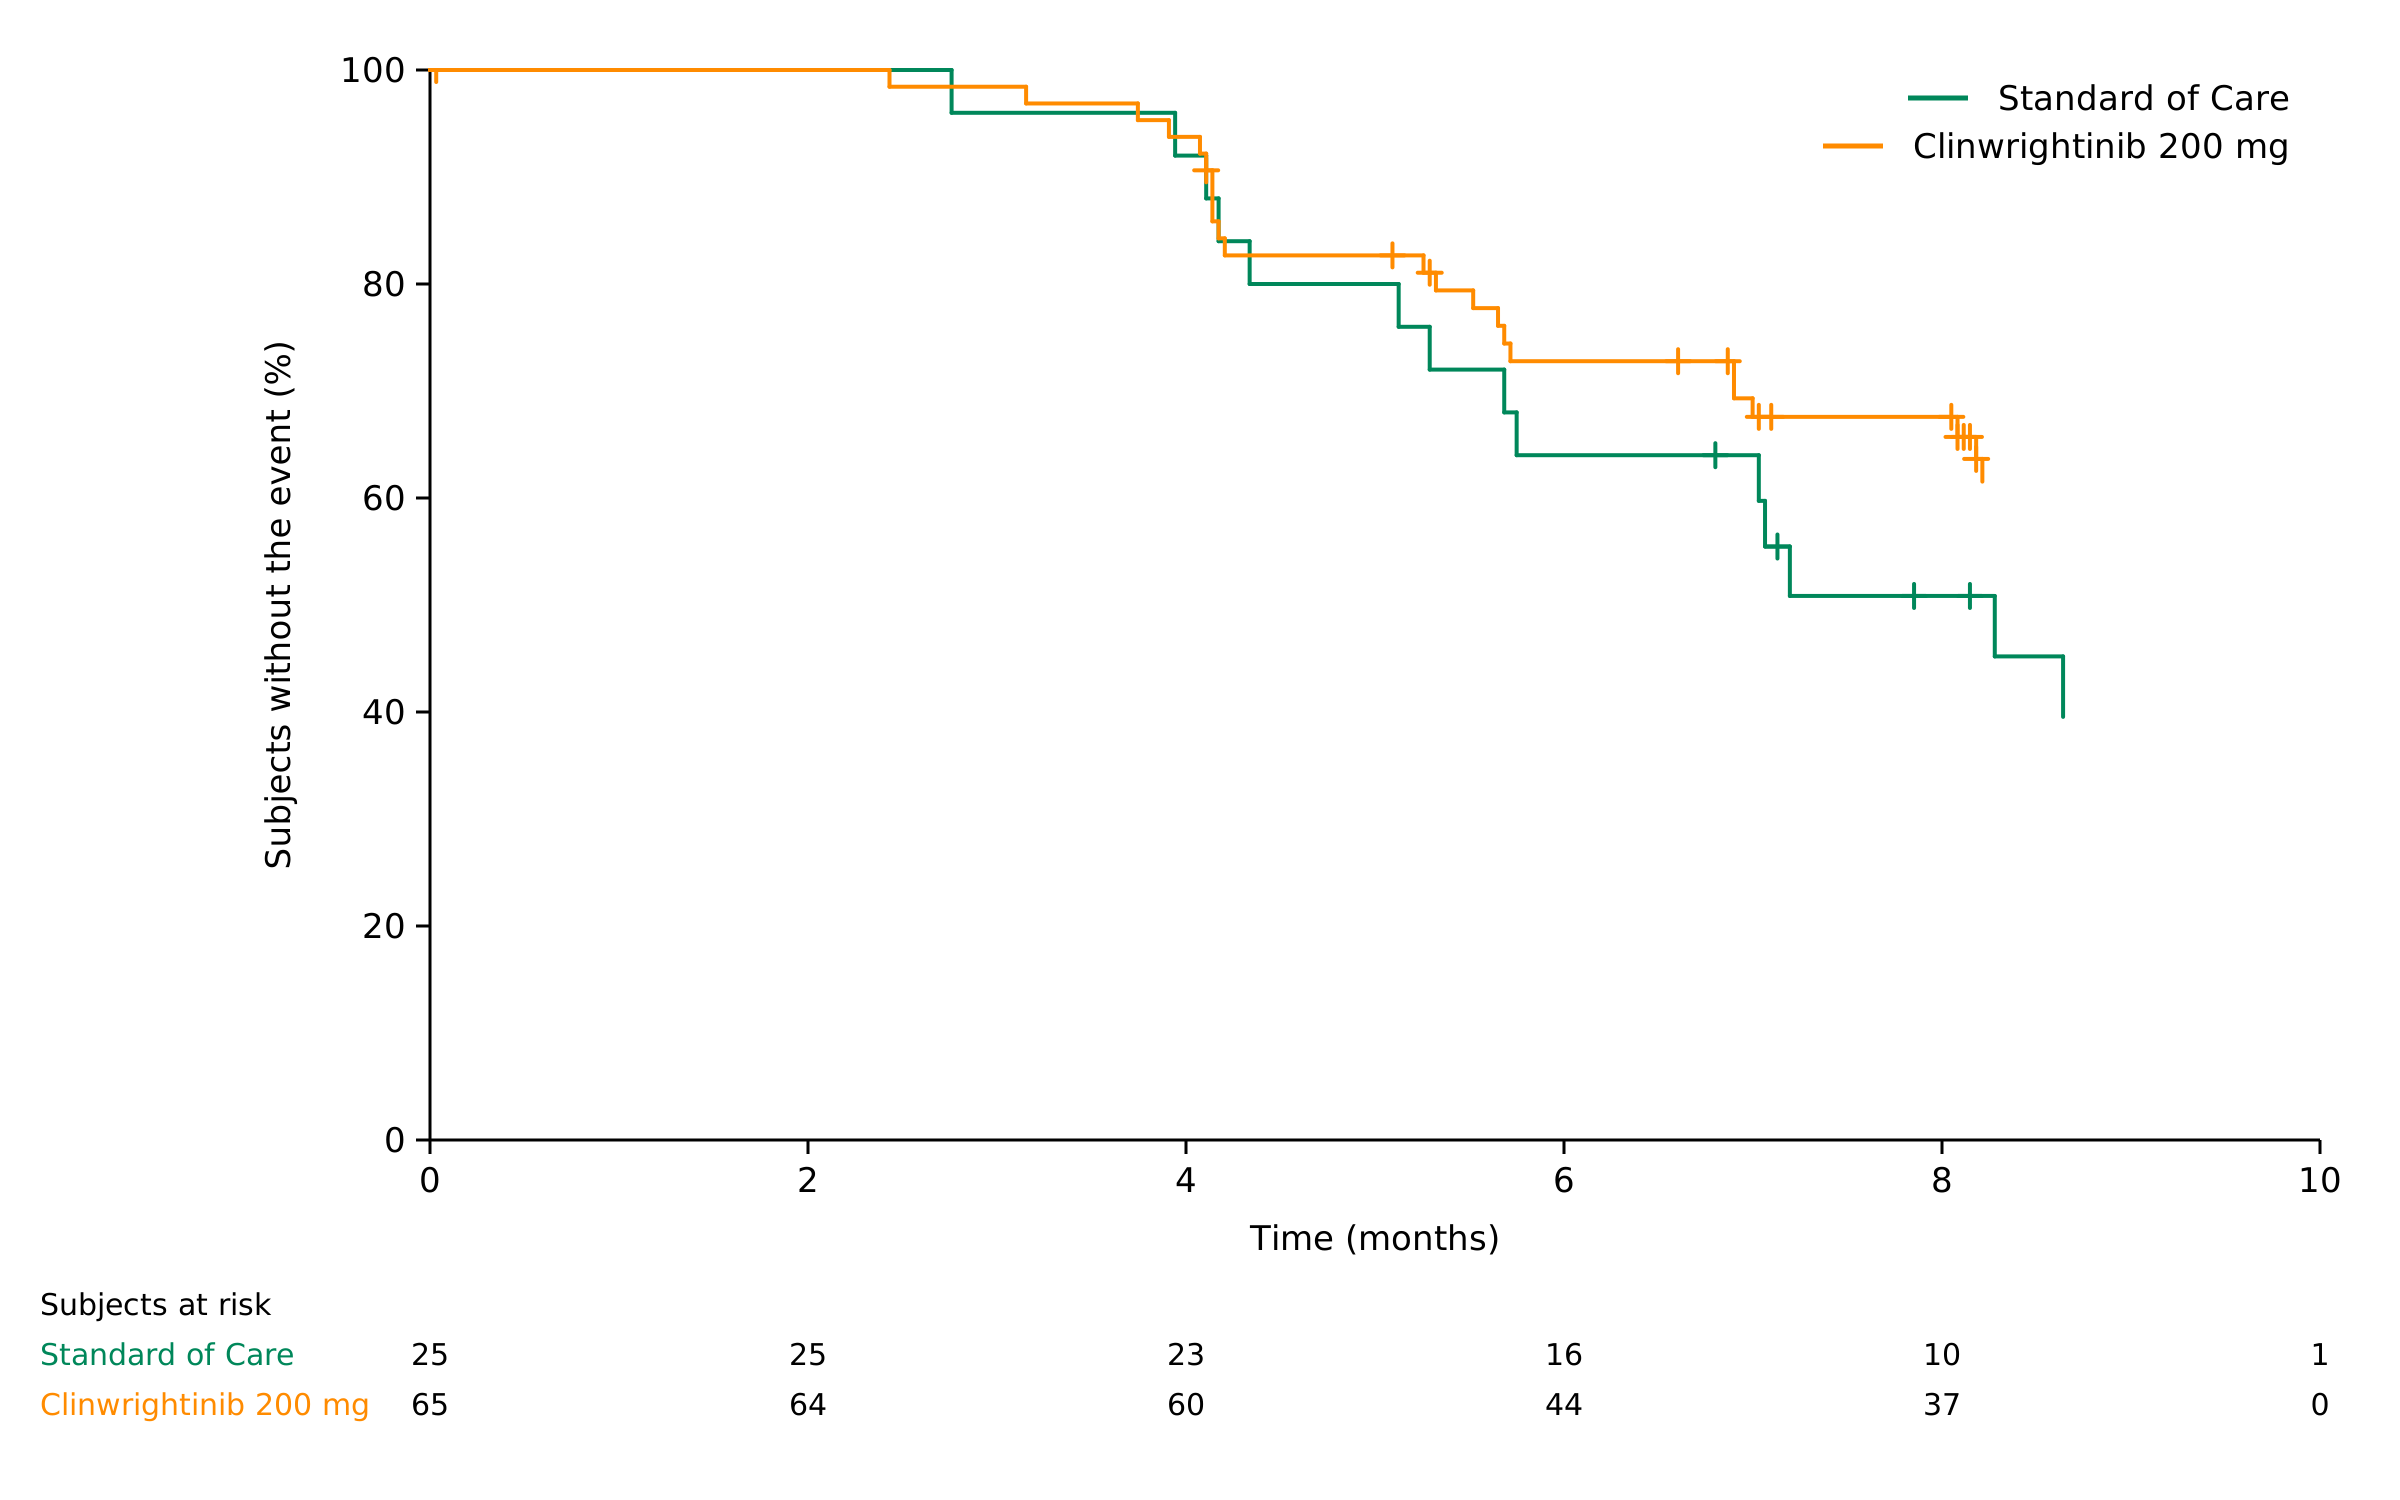
+ censored subject.
Source: ADTTE.
Program: g-14-2-1-3.sas
Program g-14-2-1-3.sas
Version 1, written from Clinwright's patterns, 2026-10-17, checks passed.
/*==== 00-header ====*/
/*----------------------------------------------------------------------------
  Output  : Figure 14.2.1.3 / Kaplan-Meier Plot of Duration of Response / Intent-to-Treat Analysis Set
  Program : g-14-2-1-3.sas   Reporting effort : CSR
  ADaM    : /work/adam (ADSL, ADLBC, ADLBH, ADVS, ADAE, ADEG, ADCM, ADMH, ADEX, ADRS, ADTR, ADTTE)
  A survival plot. The sections after this header make WORK.PLOT, one record per point:
    _series   the group of the point:
                1 Standard of Care
                2 Clinwrightinib 200 mg
    _x        Time (months)
    _y        Subjects without the event (%) (from 0 to 100)
    _mark     1 for a mark on the line (a censored subject), optional
  and WORK.ATRISK: _series, _x (a tick of the x axis), _n (subjects at risk there).
  Clinwright draws the figure (axes, ticks, legend, at-risk numbers) from them.
----------------------------------------------------------------------------*/
libname adam "/work/adam" access=readonly;
%include "/work/_lib/clinwright.sas";
%ls_setup;

/*==== 10-data ====*/
/* Made from the output's analysis: the time to event (AVAL, censored when CNSR is not 0) of ADTTE with PARAMCD = 'RSD' of the subjects of ADSL with ITTFL = 'Y', by TRT01P. */
data work._pop1; set adam.adsl(where=(ittfl = 'Y')); keep usubjid trt01p; run;
proc sort data=work._pop1; by usubjid; run;
proc sort data=adam.adtte(keep=usubjid trt01p ittfl paramcd aval cnsr where=(PARAMCD = 'RSD')) out=work._rec; by usubjid; run;
data work._an;
  merge work._rec(in=_r drop=trt01p) work._pop1(in=_p);
  by usubjid;
  if _r and _p;
  _t = aval * 0.03285420944558522;
  _cn = (cnsr ne 0); /* censored: any value but 0 */
  if trt01p in ('Standard of Care') then do; _series = 1; output; end;
  if trt01p in ('Clinwrightinib 200 mg') then do; _series = 2; output; end;
run;
proc sort data=work._an; by _series; run;
/* Kaplan-Meier estimates per group. */
proc lifetest data=work._an plots=none outsurv=work._km; time _t*_cn(1); strata _series; run;
data work.plot;
  set work._km;
  /* Tied events: only the last of them carries the estimate. */
  if missing(survival) then delete;
  _x = _t; _y = survival * 100; _mark = (_censor_ = 1);
  keep _series _x _y _mark;
run;
/* The subjects at risk at the ticks of the x axis. */
proc sql noprint; select max(_t) into :_lsmax trimmed from work._an; quit;
data work._ticks;
  _raw = max(&_lsmax, 1) / 6; _mag = 10 ** floor(log10(_raw));
  if _raw <= _mag then _step = _mag; else if _raw <= 2 * _mag then _step = 2 * _mag; else if _raw <= 5 * _mag then _step = 5 * _mag; else _step = 10 * _mag;
  do _x = 0 to &_lsmax by _step; output; end;
  keep _x;
run;
data work.atrisk;
  set work._ticks;
  do _series = 1 to 2;
    _n = 0;
    do _i = 1 to _nobs;
      set work._an(keep=_series _t rename=(_series=_s2)) point=_i nobs=_nobs;
      if _s2 = _series and _t >= _x then _n = _n + 1;
    end;
    output;
  end;
  keep _series _x _n;
run;

/*==== 90-report ====*/
/* 90-report: Clinwright draws the figure from WORK.PLOT (and WORK.ATRISK) with the shell's titles, axes and footnotes. */
%ls_plot_check(columns=_series _x _y);
%ls_plot_export;